


Identify Equity Gaps
A key aspect of Pathways to Results is identifying equity gaps, which can be approached in multiple ways and at different complexity levels. The following examples illustrate some approaches that are commonly used by Pathways to Results teams. See the Examining Equitable Representation in Programs of Study document for an example of a more complex approach. Whichever method is used, a comparative analysis in which student outcomes are analyzed for different subgroups is fundamental to Pathways to Results.
Comparing Outcomes Among Disaggregated Subgroups Within a Program
The following example illustrates how examining disaggregated data can be used to identify an equity gap. In this case, the team looked at disaggregated-outcomes data by race and ethnicity, socioeconomic status, gender, age, and other student characteristics that were identified as relevant by the team. Disaggregating data allows team members to recognize gaps among subgroups. Table 1 shows the data and compares the outcome of the courses attempted versus the courses completed in a gateway course that is disaggregated by race and ethnicity.
Table 1. Attempted versus Completed in Gateway Course Disaggregated by Race and Ethnicity
| Outcome | African American | American Indian or Alaska Native | Asian American | Latinx | Native Hawaii & Pacific Islanders | Two or More Races | White | Total |
| # of students attempted course | 43 | 10 | 15 | 18 | 10 | 18 | 72 | 194 |
| # of students completing course | 28 | 6 | 11 | 12 | 6 | 8 | 53 | 127 |
| % course completion to attempted | 65% | 60% | 73% | 67% | 60% | 44% | 74% | 65% |
In this example, the total proportion of students who completed the course versus the number of students who attempted the selected course in the program is 65%. This is a critical step in outcomes assessment for any program or pathway. Analysis of these data show large differences based on race and ethnic subgroups. For example, the data show that a smaller percentage of African American, American Indian or Alaska Native, and Latinx students who attempted the course went on to successfully complete the course compared to the White students in the program. Because there are more White students in the program, the total percentage of 65% mostly reflects the percent of course-completion-to-attempted rate of the White students, which is relatively high at 74%.
Comparing Program Level to Disaggregated Institutional Data
Equity is also measured comparatively by examining disaggregated program-level data to disaggregated institutional-level data. This allows the team to compare student outcomes at the program level to the institutional level, revealing results that are relative to critical questions about student success in the pathway or program of study. Consider the examples of program-level data in Table 1 above and institutional-level data in Table 2 and Graph 1 below.
Table 2. Attempted versus Completed in Gateway Course Disaggregated by Race and Ethnicity
| Outcome | African American | Native American & Alaska Natives | Asian American | Latinx | Native Hawaii & Pacific Islanders | Two or More Races | White | Total |
| # of students who attempted a course | 750 | 25 | 325 | 524 | 23 | 45 | 2008 | 3780 |
| # of students completing a course | 552 | 17 | 275 | 360 | 16 | 34 | 1575 | 2875 |
| % course completion to attempted | 74% | 68% | 85% | 69% | 70% | 76% | 78% | 76% |
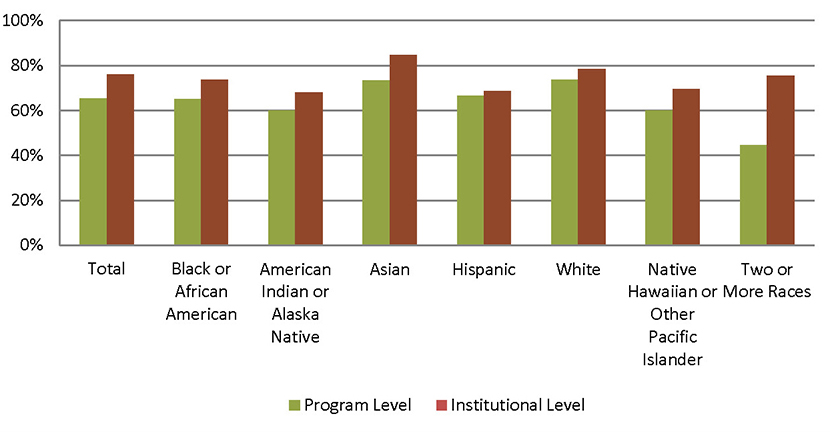
This comparative analysis suggests a number of differences between program-level and institutional-level outcomes. For both institutional and program data, White students have better outcomes than African Americans, Native American and Alaska Natives,
Latinx students, Native Hawaiian and Pacific Islander students, and multiracial students. Outcomes for Latinx students are similar at the program level (67%) and institutional level (69%), but the performance of African American students is lower
at the program level (70%) than institutional level (74%). Outcomes for Asian American students are better than White students at the program level and institutional level, but there is nearly a 12% disparity between institutional- and program-level
data for Asian Americans.
When disaggregating student-outcomes data, Pathways to Results teams should be cautious about interpreting data based on small numbers of students in a single cohort. For example, in Table 2 there are only 10 Native American and Alaska Native students. Similarly, course enrollment of Asian American, Latinx, and Native Hawaiian and Pacific Islander students is low compared to African American and White students. To achieve larger student numbers, one approach is to look at multiple student cohorts in the pathway over a period of time or to look across pathways of programs (e.g., all manufacturing programs). For example, the PTR team could collect outcomes data for students who enrolled in the program between FY 2010-2014. Increasing the number of students in the analysis leads to increased confidence and integrity of the data and helps the team determine important student-outcome trends. However, teams should also exercise caution in aggregating data if unique circumstances (such as a one-time training program that enrolled a large group of students in a single course) can cause temporary fluctuations in student outcomes.
Considering equity at the program and institutional levels is an important endeavor, but it is only the beginning. It may also be important to compare data that represents the program level to data that shows the larger context of the district, the community and region, and the state and nation. These exercises provide additional insights into how the programs of study are working toward or against educational equity.
Still, parity among student groups does not necessarily mean equity since the needs of certain sub-populations of students can be substantially greater than others; this indicator of the differences among sub-groups deserves further study. Pathways to Results teams need to consider results with a deep understanding of the program, institution, and larger contexts.